Charts.
AMER SPORTS
 |
| Long-term trend up |
 |
| Out of the slightly rising range, but within a horizontal range. If gets much lower from here, the longer-term outlook becomes negative. |
 |
| IF a break above the bear channel, it would suggest a new visit to €28. |
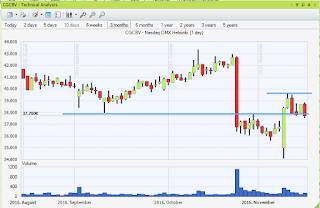
CARGOTEC
 |
| Saw-like, seems to be on the high end |
 |
| On its way lower within the bull channel - attractive around €28-30 |
 |
| A possible test of resistance levels, before turning lower? |
CITYCON
 |
| No comments |
 |
| Lower highs, lower lows, could see a marginal new low below €2, just like previously. |
 |
| As long as it is trending lower within a channel, don't. |
ELISA
 |
| Looks bearish. Meaningful support around €20. |
 |
| Support level broken - bearish. |
 |
| Notice the attempt to reach the resistance level. Before some sort of strength, don't |
FISKARS
 |
| The bear is getting close to the size of the previous bears. Begin watching. |
 |
| Seems to like pivoting around the €18-level. |
 |
| Boring. |
FORTUM
 |
| Descending tops, bearish triangle-like. Price was too happy below the
two previous major bottoms, and the rally from the 2016 lows wasn't
convincing. OR the range suggests an eventual move to €18-20. |
 |
| Within the longer-term bear, the 2016 price action is a flag-like structre OR 2016 price action is a double bottom, followed by a shallow rising pattern, and we are close to the bottom. |
 |
| Still no signs of a bottom. Stay away until the daily chart shows some strength. Maybe downside momentum begins stalling as the previous low is approached? |
